Deploy And Operate Monitoring
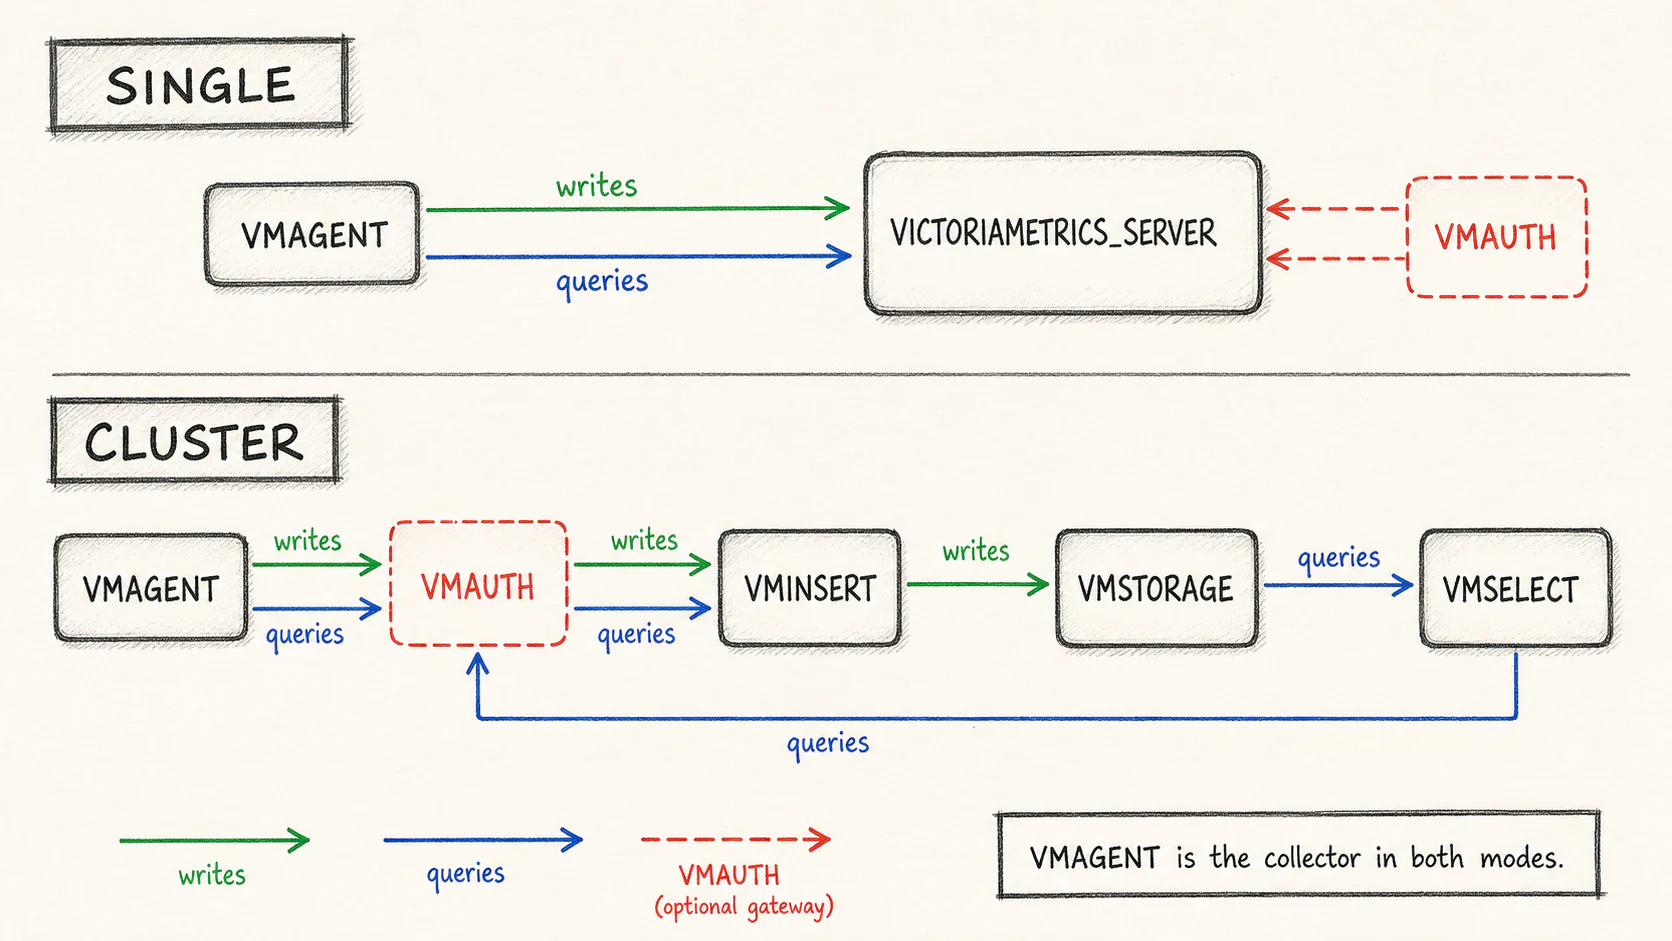
| Topology | Components | Role |
|---|---|---|
deployment_mode=single | One VICTORIAMETRICS_SERVER and at least one VMAGENT | One storage process handles writes and queries |
deployment_mode=cluster | VMSTORAGE, VMINSERT, VMSELECT, and VMAGENT | Separate storage, write, and read roles |
Optional VMAUTH | In front of the selected write/read topology | A stable gateway with optional configured authentication |
Do not assign both storage modes as though they were independent required masters. The service scripts validate the topology before starting components. Size storage, replication, scrape frequency, and queue capacity for the actual workload; the defaults are not a capacity recommendation.
Install Through Ambari
- Open Add Service, or select VictoriaMetrics during cluster installation.
- Assign components for the chosen topology. For a small initial deployment, select single mode with VictoriaMetrics Server and VMAGENT; add VMAUTH if a gateway is needed.
- Review the
victoriametrics,victoriametrics-scrape,victoriametrics-auth, andvictoriametrics-envconfiguration types. - Keep
managed_discovery_identity=trueunless an explicitly managed replacement identity is required. Ambari provisions the cluster-scoped identity and discovery configuration before the first VMAGENT start. Do not substitute an administrator password in a scrape template. - Configure discovery protocol, port, and CA to match the deployed Ambari API. Keep
ambari_sd_tls_insecure_skip_verify=falsefor verified TLS. - Start the storage components, optional gateway, and VMAGENT through the service workflow. Follow the background request to completion and inspect individual task failures before retrying.
- Confirm the component state, discovered targets, recent samples, and datasource queries independently.
Key Defaults
| Configuration | Default | Meaning |
|---|---|---|
Agent [prometheus] enabled | true on Linux | Start the built-in exporter |
Agent bind_address / port | 0.0.0.0 / 9101 | Restrict reachability with interface/firewall policy |
Server prometheus.agent.metrics.port | Must match Agent ports | Port advertised by HTTP discovery |
scrape_interval / scrape_timeout | 30s / 10s | VMAGENT scrape timing |
http_sd_refresh_interval | 30s | Discovery refresh |
retention_period | 12 | VictoriaMetrics interprets this as months; explicit values such as 30d are also supported |
remote_write_max_disk_usage | 10GB | Queue limit per remote-write URL |
vmagent_replication_factor | 1, at most 2 | Scrape redundancy, separate from storage replication |
require_authentication | false | Enable and configure VMAUTH authentication when required |
Agent port changes must be coordinated with Server discovery configuration. Changing a scrape endpoint is different from changing a Stack component's own Web UI port.
Network Paths
| Connection | Default destination port |
|---|---|
| VMAGENT to Ambari discovery | Ambari API port, 8080 by default; use the configured HTTPS endpoint when enabled |
| VMAGENT to Agent | 9101 |
| Single-node ingestion/query | 8428 |
| VMINSERT / VMSELECT HTTP | 8480 / 8481 |
| VMSTORAGE HTTP / insert / select | 8482 / 8400 / 8401 |
| VMAGENT HTTP / VMAUTH | 8429 / 8427 |
The Agent exporter has no application-level authentication. VMAUTH credentials protect its gateway, not the Agent's port. Restrict both paths independently.
Verify Each Layer
On an Agent host, verify exporter health and host metrics:
curl --fail http://127.0.0.1:9101/-/healthy
curl --fail http://127.0.0.1:9101/metrics
From an authorized management environment, verify discovery. Set the URL and cluster for the installation; curl prompts for the user's password rather than placing it in the command:
export AMBARI_URL=https://ambari.example.com:8443
export AMBARI_USER=metrics-reader
export CLUSTER_NAME=cluster1
curl --fail --user "$AMBARI_USER" "$AMBARI_URL/api/v1/clusters/$CLUSTER_NAME/prometheus_targets"
A healthy exporter is not proof that every component scrape works. Use Monitoring > Targets and run up{cluster="cluster1",ambari_target="host"} in the explorer. Open a discovered component route only after obtaining its actual route ID from discovery.
Failure And Recovery
| Symptom | Check |
|---|---|
| No exporter response | Agent log, exporter enablement/bind/port, firewall, and whether the host is Linux |
| Discovery returns 401/403 | Identity credentials, cluster metrics-view authorization, API protocol/port, and CA |
| Host target works but a component target fails | Effective component configuration, upstream endpoint, profile match, keytab/principal, and TLS |
| Targets are up but charts are empty | Datasource URL, cluster selector, time range, remote-write path, storage health, and ingestion delay |
| Queue grows | Remote-write reachability, storage capacity, gateway authentication, and queue disk space |
| An assignment update is rejected | Descriptor/profile validation and Agent logs; the last valid assignment remains active |
Keep the default managed URL derivation unless an override is intentional. An incorrect remote_write_url can bypass the expected gateway or select the wrong tenant. After a topology or configuration change, verify discovery, writes, and reads again.
Implementation References
See the pinned service scripts and templates and telemetry architecture.